


Mapped in 2026: U.S. cities with the most remote workers, and why the data still matters
A Visual Capitalist map making the rounds in 2026 ranks U.S. metro areas by how many residents usually work from home. The headline is classic: remote work is not evenly distributed, and a few metros dominate the numbers.
Imagine doing great work from anywhere and still growing your career. Browse Remotly’s fresh remote roles and let your next adventure begin.
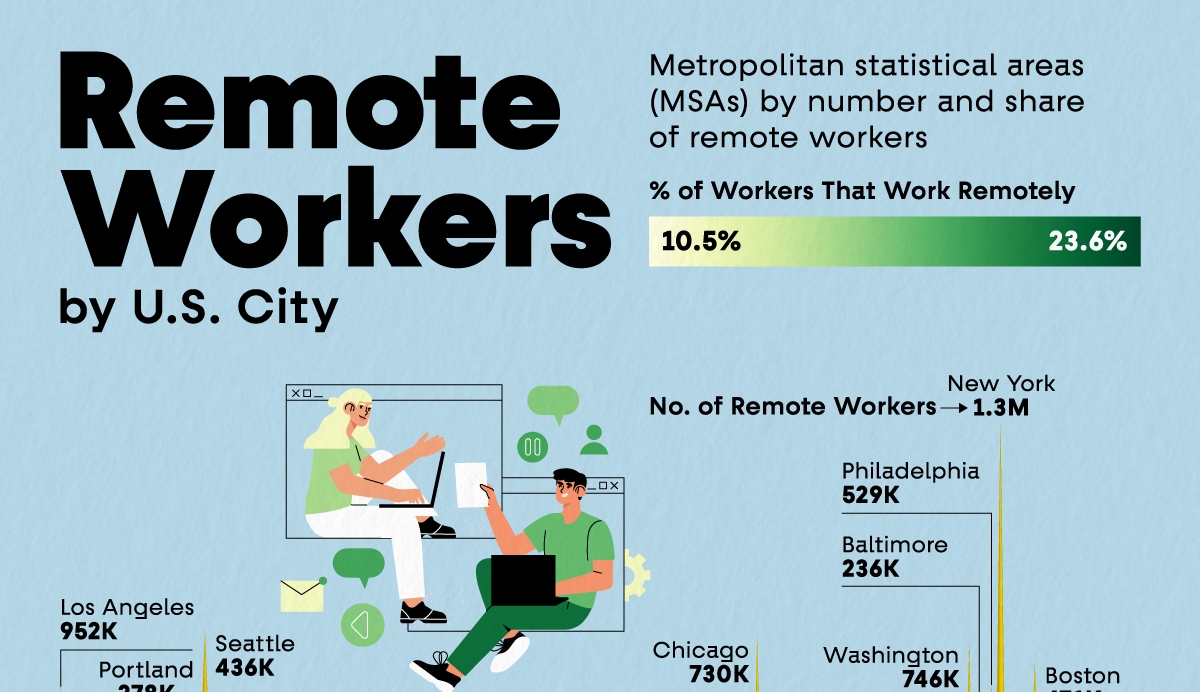
The footnote is more important. Visual Capitalist’s graphic is built on 2023 metro-level Census commuting estimates. That is not a mistake, it is the reality of how city-by-city datasets are published and packaged. The Voronoi post that hosts the chart spells it out: it shows the top 30 U.S. metropolitan statistical areas by number of remote workers in 2023, using U.S. Census Bureau figures.
So, yes, this is a 2026 story. It is also a reminder that “latest available” and “current year” do not always line up.
Why a 2026 map uses 2023 metro data
U.S. commuting and work-location statistics mostly come from the American Community Survey (ACS). The ACS produces annual estimates, but the more detailed the geography, the more you feel the release lag.
The Census Bureau’s own “Commuting At A Glance” page (updated September 2025) shows that in 2024, 13.3% of workers worked from home, down slightly from 13.8% in 2023. (Census.gov) This tells you two things:
- The pipeline is moving, but the “most recent year” is often one to two years behind the calendar year people are reading in.
- Remote work is not snapping back to 2019, it is settling into a new range.
The 2024 ACS 1-year estimates were released in September 2025, according to the Census press kit. (Census.gov) That makes 2024 data “current” in 2026 terms, but it does not automatically mean every popular metro ranking chart has been rebuilt on it.
What the Visual Capitalist map actually measures
This matters because “remote work” can mean three different things in public debates:
- Usually worked from home (ACS commuting lens, what the map uses)
- Worked from home at least some time (broader participation)
- Fully remote vs hybrid vs on-site (policy lens)
The Visual Capitalist and Voronoi chart is the first type: usual work-from-home. It will understate hybrid in many cases, because a hybrid worker might still report commuting as their “usual” pattern.
The rankings show where remote workers are concentrated. If you’re actually looking for a role, the more useful signal is live listings you can filter by location and pay.
The numbers Visual Capitalist highlights
The Voronoi post highlights a split that often gets missed:
By sheer headcount, the biggest metros still win
The chart notes that New York-Newark-Jersey City and Los Angeles-Long Beach-Anaheim have the largest total remote-worker counts, at 1.3 million and 952,000 respectively. (voronoiapp.com)
But remote work is not the majority mode in either place. The same source reports remote work is 12.5% of New York’s workforce and 13.8% of Los Angeles’ workforce. (voronoiapp.com)
By share of the workforce, smaller metros can lead
The post also calls out Boulder, Colorado as the highest-share metro on the chart at 26.2% (about 49,000 people), with Austin-Round Rock-San Marcos close behind at 23.6% (about 339,000 people). (voronoiapp.com)
That gives you two different “remote capitals”:
- Volume hubs (huge total numbers): New York, Los Angeles
- Intensity hubs (high work-from-home share): Boulder, Austin
2026 context: remote work is still big, even if it is noisier
If the map feels like it is describing a moment that has already passed, it is worth checking broader indicators.
Pew Research found that in early 2023, 35% of workers with jobs that can be done remotely were working from home all of the time, with another large group working hybrid. (Pew Research Center)
Separately, the U.S. Bureau of Labor Statistics reported that 35% of employed people did some or all of their work at home on days they worked in 2023. (Bureau of Labor Statistics)
Those are different measures from the ACS “usual” question, but they point in the same direction: remote work is now a structural feature of the labor market, not a temporary perk.
Imagine doing great work from anywhere and still growing your career. Browse Remotly’s fresh remote roles and let your next adventure begin.
What this means for remote job seekers
1) Treat remote-heavy metros as “ecosystems”, not shortcuts
A metro with lots of remote workers tends to have:
- more coworking and third-space options
- more employers with distributed routines
- social networks where remote work is normal
That is helpful if you are building a career without the office default.
2) “Remote city” does not mean “more remote jobs”
The map counts where remote workers live, not where remote employers hire. Remote hiring is still heavily shaped by company policy, tax and compliance, and time zone coverage.
Use the map as a signal that a place has remote density, not as proof your next job is local.
3) Ask questions that reveal whether the employer can actually run remote work
Remote-friendly companies can answer these cleanly:
- What does onboarding look like for remote hires?
- How are performance and promotions handled for remote staff?
- What is the written standard for meetings, documentation, and async updates?
If you hear “we’re figuring it out,” believe them.
What this means for employers
1) The talent is clustered, even in a “work from anywhere” era
Remote work enables mobility, but it has not dissolved geography. Many remote workers still concentrate in large metros and a handful of high-share hubs. (voronoiapp.com)
2) Use metro data to stress-test your pay and retention assumptions
If you hire nationally, your “average candidate” is often competing against big-metro labor markets. That shapes salary expectations, benefits norms, and the quality bar candidates expect.
3) Do not confuse a return-to-office policy with a collaboration strategy
The Census trend shows work-from-home share dipped slightly from 2023 to 2024, but it remains substantial. (Census.gov) The strategic question is not “can we force more office time,” it is “have we designed work so people can perform and grow.”
Takeaways
- Visual Capitalist’s 2026 map is based on 2023 metro-level Census commuting estimates, because that is the dataset the chart is built on. (voronoiapp.com)
- Biggest remote-worker totals: New York (1.3m) and Los Angeles (952k), but their work-from-home shares are 12.5% and 13.8% respectively. (voronoiapp.com)
- Highest work-from-home shares highlighted: Boulder (26.2%) and Austin (23.6%). (voronoiapp.com)
- Newer national context: the Census reports 13.3% worked from home in 2024, down from 13.8% in 2023. (Census.gov)
- The 2024 ACS 1-year estimates were released in September 2025, which explains why “latest” often trails the calendar year. (Census.gov)
References
- Visual Capitalist via Voronoi, “Austin Has One Of The Greatest Shares of Remote Workers in the U.S.” (metro ranking based on 2023 Census commuting data). (voronoiapp.com)
- U.S. Census Bureau, “United States Commuting At A Glance: ACS 1-Year Estimates” (2024 worked-from-home share 13.3% vs 13.8% in 2023). (Census.gov)
- U.S. Census Bureau, “2024 ACS 1-year Estimates Press Kit” (release timing and scope). (Census.gov)
- Pew Research Center, “About a third of U.S. workers who can work from home do so all the time” (35% statistic). (Pew Research Center)
- U.S. Bureau of Labor Statistics TED, “35 percent of employed people did some or all of their work at home on days they worked in 2023.” (Bureau of Labor Statistics)